Code Changes Lines
Question: What is the sum of the number of lines touched (lines added plus lines removed) in all changes to the source code during a certain period?
When introducing changes to the source code, developers touch (edit, add, remove) lines of the source code files. This metric considers the aggregated number of lines touched by changes to the source code performed during a certain period. This means that if a certain line in a certain file is touched in three different changes, it will count as three lines. Since in most source code management systems it is difficult or impossible to tell accurately if a lines was removed and then added, or just edited, we will consider editing a line as removing it and later adding it back with a new content. Each of those (removing and adding) will be considered as “touching”. Therefore, if a certain line in a certain file is edited three times, it will count as six different changes (three removals, and three additions).
For this matter, we consider changes to the source code as defined in Code Changes. Lines of code will be any line of a source code file, including comments and blank lines.
Objectives
Volume of coding activity: Although code changes can be a proxy to the coding activity of a project, not all changes are the same. Considering the aggregated number of lines touched in all changes gives a complementary idea of how large the changes are, and in general, how large is the volume of coding activity.
Visualizations
Steps
-
Click on the
Visualizeoption in the sidebar and click on+to pick your visualization type. ChooseAreaas visualization type. -
Select
gitas index. -
For
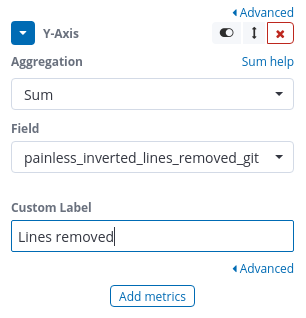
Metrics, we’ll need to add 2 of them, that is twoY-axis. For the first one set the y-axis aggregation toSumand field tolines_added. SetLines addedfor the custom label. For the 2nd Y-axis, set the aggregation toSumand field topainless_inverted_lines_removed_git. Set the custom label toLines removed.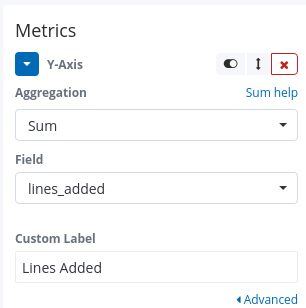
-
For
Buckets, pick the bucket type ofX-axis. -
Set the aggregation to
Date Histogramand field togrimoire_creation_dateand interval toAuto. SetTimefor the custom label.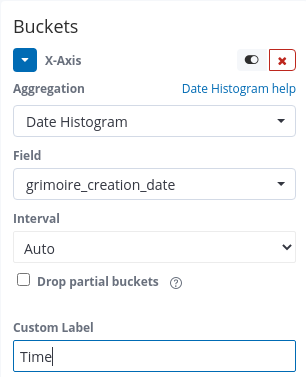
-
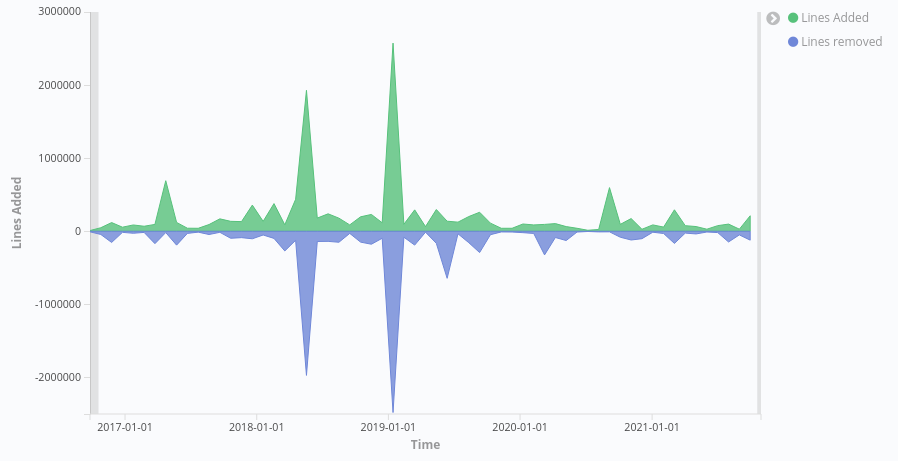
In the end, your visualization should like the following,