Bustiness
Question: How are short timeframes of intense activity, followed by a corresponding return to a typical pattern of activity, observed in a project ?
There are a number of reasons that may prompt a sudden increase or decrease in the amount of activity within a repository. These increases and decreases appear both as a sudden change in activity against the average amount of activity. Burstiness is a way of understanding the cycle of activity in existing metrics, like issues, merge requests, mailing lists, commits, or comments. Examples of root causes for bursts in activity include:
- Release cycles
- Global pandemics
- Hackathon activities
- Mentorship programs
- Conferences, meetups, and other events where tools are presented
- Conventional and social media announcements and mentions
- Critical bugs as raising awareness and getting people’s attention
- Community design meetings or brainstorming meetings to address a particular issue
- Community members show up from another community that is relying on your project (e.g., dependencies)
Visualization
Steps
-
For
metricsset the aggregation toUnique Countand field tohash.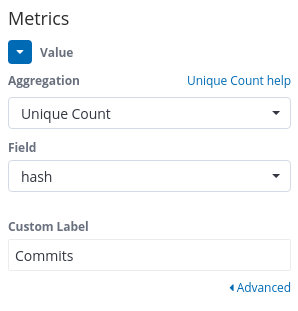
-
For
Buckets, set the aggregation toDate HistogramforX-axisand fieldgrimoire_creation_date. Set the interval to whiever you like. I’ll usemonthlyfor this example.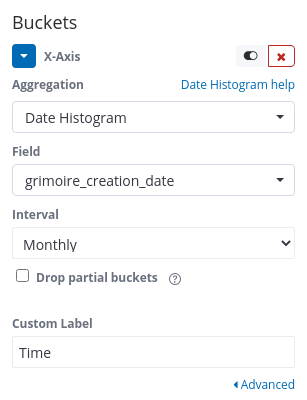
-
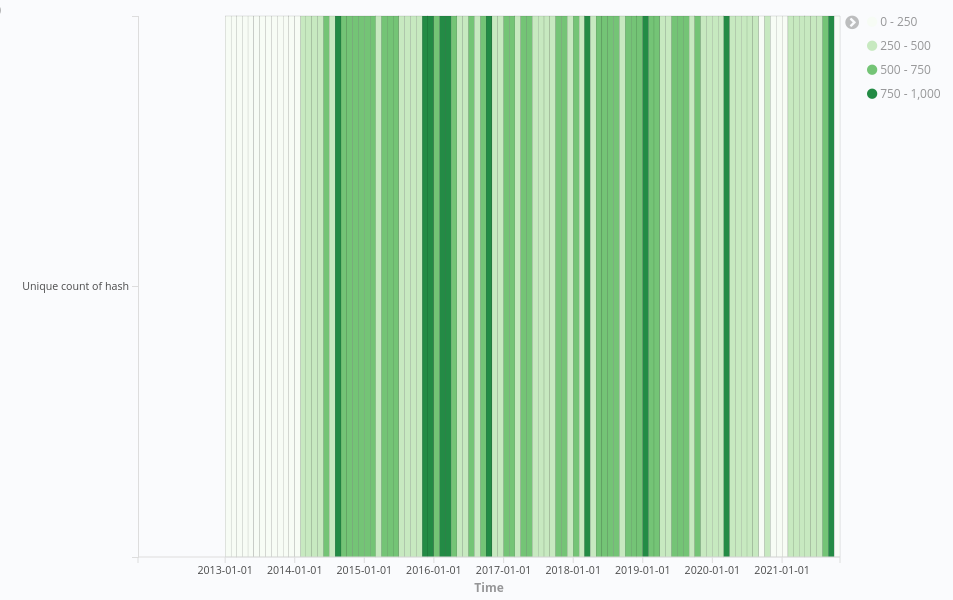
Once you have the above done, click on the play button and you should see something similar to the following.